Continuous Integration Testing
Continuous Integration Testing
Continuous integration (CI) is a development practice where developers integrate code into a shared repository frequently. Each integration will be verified by automated tests.
Automated testing before your pull request
To ensure the quality of our IND scripts and the confidence when releasing a new knowledge version, we will run knowledge integration tests on every pull request.
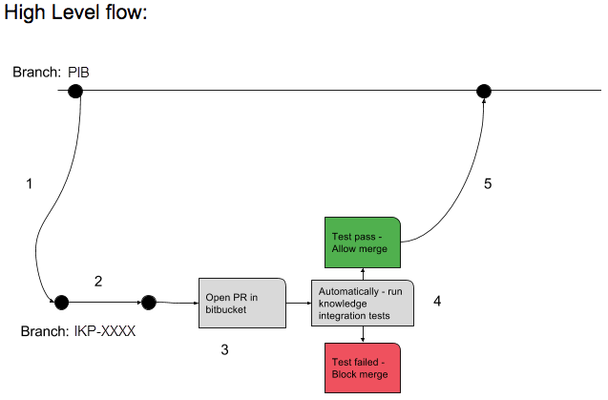
- When starting work on a new task/feature the IKEs will create a working branch (named after the Jira IKP ticket) branched from the correct Platform Integration Branch (PIB)
- IKEs develop code and commit/push their code to the working branch
- Once the code is ready for prime time, the IKEs will open a pull request from their working branch to the correct PIB
- When the pull request is created, Bitbucket will trigger an automatic job (on Jenkins) that runs IND integration tests:
- If any of the integration tests fails, the pull request will be blocked and merge will not be allowed until code is committed (and pushed to the working branch) to fix the broken tests
- When all tests pass, merge will be allowed
- CI job is being triggered also on every commit to an existing PR
- If you need to invoke a CI automation test, enter "test this please" in the comments section of your pull request.
FAQ:
- Q: How do I create test cases?
A: Please see Indeni knowledge reformed directory structure below.
In short - you can use command-runner passing ind script and input file to generate test case - Q: How many test cases should I have?A: It is recommended to have multiple test cases including negative testing if applicable.
- Q: Can I run test locally before I create PR to ensure that they will pass once PR is created?
A: Yes! You can use command-runner to run test case, Please refer to Indeni knowledge reformed directory structure below. - Q: How can I see the test results
A: Click the link in the upper right of the PR: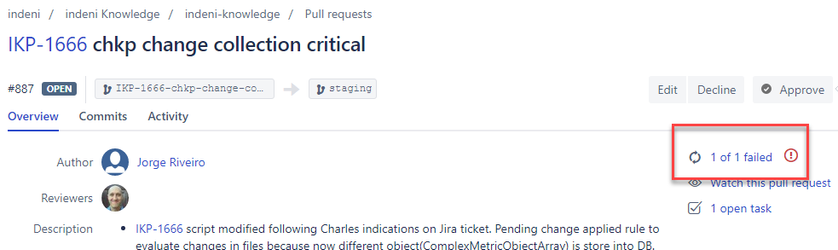
- If the tests fail, and for some reason I want to restart the CI test run, how do I do that?
Make a comment in the PR with the text "test this please". - Q: What else this (cool) Continuous Integration can/will do?
A: We are planning to add more validity checks in the near futures such as:
- IND syntax check
- Ensure no duplicate command
- Measure IND execution time and allow/block merge
- Automatically suggest for performance improvement
- And more, please suggest your own!
Indeni knowledge reformed directory structure
See this video for a walk-through of creating/migrating tests to the new directory structure: https://drive.google.com/file/d/16nTpzoZBTlSwdaPkz40eXUVOM96IuBNE/view
Up until now the knowledge repository contained the collector commands (the .ind scripts) in a fairly simple directory structure:
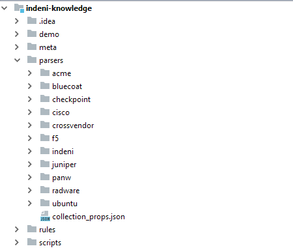
All the commands are placed in different folders / packages under the parsers directory of the project. Alongside the commands there were also the .input and .output files, which were used to either test the commands or to get an idea of what should the input and output look like - the .input describes the device’s response to the command’s remote operation, while the .output describes the parsed result.
We now have changed this structure in order to make it possible to create more tests per command and in order to make it more compatible with developers’ conventions.
The new structure
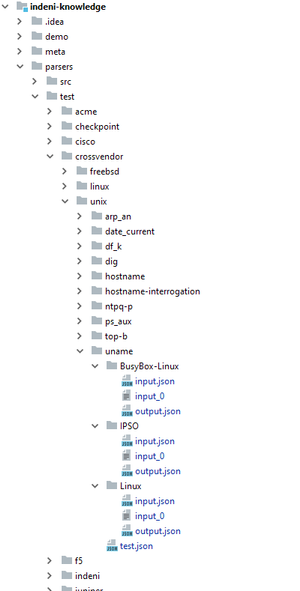
The first change is the separation of the actual commands -- the .ind files -- from the test files; the commands are now located under parsers/src, while the test files are located under parsers/test.
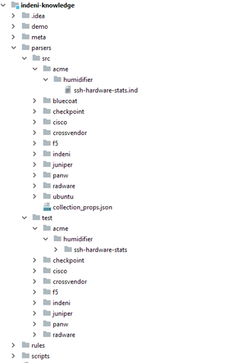
Each command has a test directory containing all of its test files. The directory is located in the same path and file-name of the command itself; for instance, if a command is located in parsers/src/path/to/command.ind, then its tests will be located in parsers/test/path/to/command/.
The test file
Inside the test directory there is the main test file, named test.json, which describes the structure of tests, which is basically a combination of separate test-cases. The file looks as follows:
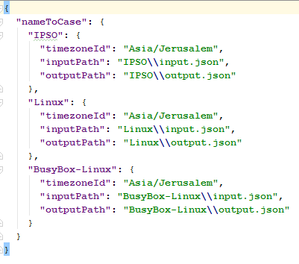
It is a map from the name of the test-case to all the properties needed in order to run it. As you can see, each test-case has its own input and output files, where an input file might actually bundle a few inputs together (more on that later). The paths are relative to the test directory, and can be written in either unix format (single slash /) or windows format (double backslash \\).
There are additional properties associated with each test-case, such as the time-zone in which the test-case has been created (which may affect the output of certain commands that rely on the time-zone in order to parse timestamps).
Notice that the files of each test-case are located in a folder with the name of the test-case:
The input file
The input file, named input.json, has a structure that supports multiple input files; but why would we need multiple input files in a test-case? Doesn’t a device respond with a single output for a remote operation?
While this is true, some commands have multiple-steps; meaning, more than one remote-operation will be sent to the device during a single execution of the command.
Here is an example for an input.json of a command with one step only:
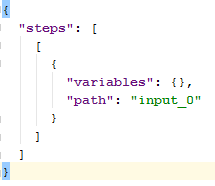
The JSON contains the steps value which is an array where each item describes the device’s responses for each step (the steps are ordered in the same order as in the command). Each item of this array is in fact its own array, since there may be multiple inputs for a step - one for each unique combination of dynamic variables.
Note that the inputs in the main input file are merely paths to the files containing the actual inputs (the paths are relative to the main file).
Here is an example of an input file describing the device’s response for a command with multiple steps (and multiple remote-operations):
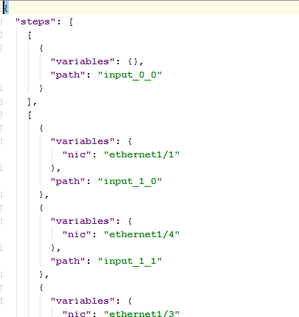
The first step will always have but a single input and it’s never executed with any dynamic variables, while the next steps will always have one or more inputs, each associated with some dynamic variables.
The output file
The output file, named output.json, describes the final output of the command, after all the parsing is done:
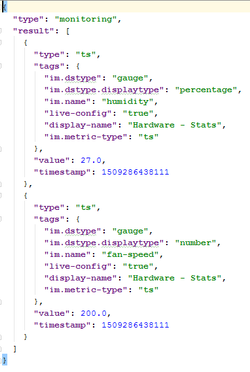
The output of monitoring commands will contain metrics (either time-series / double or snapshot / complex), while the output of interrogation commands will contain the device tags.